


 Pressure

Bourdon Tube
7 products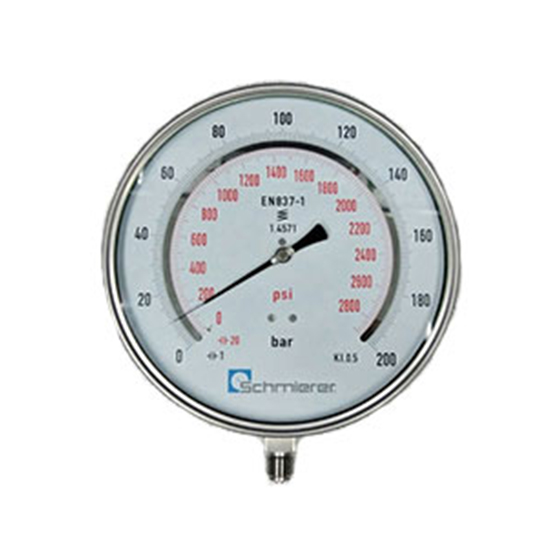
Boiler
2 productsChemical
3 products
Phenolic
1 product
Differential
7 products
Capsule
3 products
Test Pressure Gauge
5 products
Contact
4 products
Diaphragm
3 products
Diaphragm Seal
1 product
Digital
2 products
Pressure Transmitter
10 products
Pressure Switch
5 products
Load and Force
11 products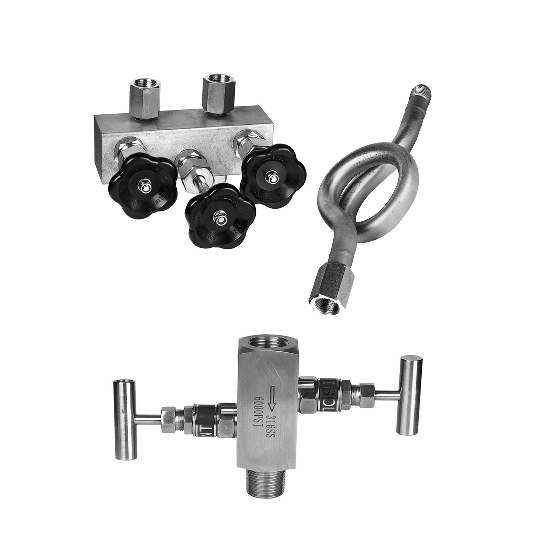
Accessories
15 products- Temperature
RTD
5 products
Bimetallic
2 products
Gas Filled
2 products
Non-Replaceable Inserts
3 products
Replaceable Inserts
4 products
Ceramic Protection
7 products
Mineral Insulated
4 products
Flameproof and Intrinsically Safe
7 products
Surface and Machinery
30 products
Food and Pharma
7 products
HVAC
9 products
Acids, Alkalis, Salts
4 products
Temperature Switch
1 product
Thermowell
16 products
Indicator, Controller
8 products
Accessories
9 products
Humidity
7 productsThermocouple
50 products
Cable Sensors
38 productsHead Sensors
9 products
High Temperature
6 products
Temperature Transmitter
6 products - Flow

Electro Magnetic
2 products
Vortex
3 products
Swirl
1 product
Ultrasonic
7 products
Coriolis Mass Flowmeter
28 products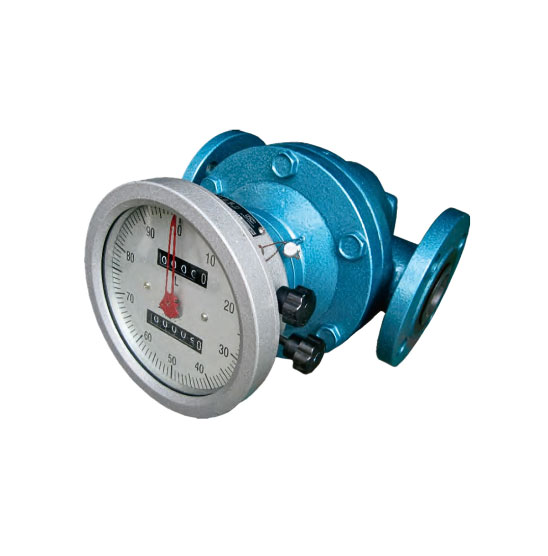
Positive Displacement
6 products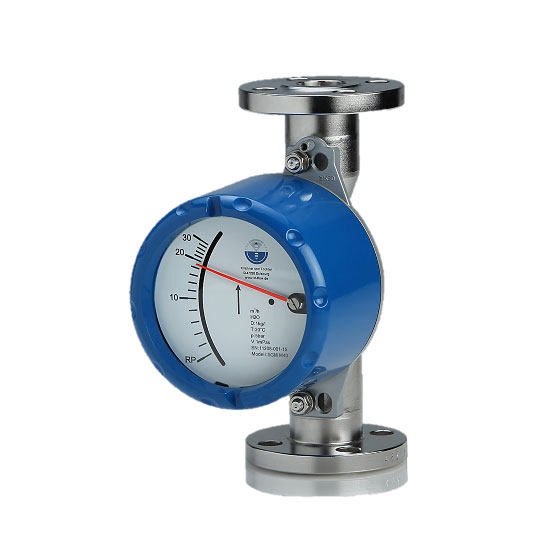
Variable Area
1 product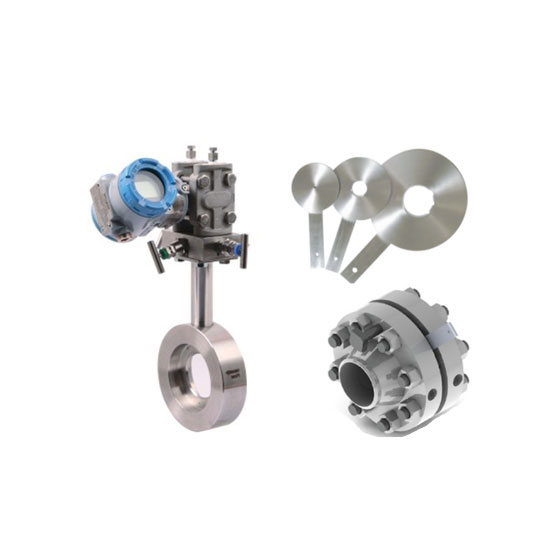
Differential Pressure
7 products
Turbine
4 products
Flap
1 product
Side Glass
1 product
Thermal gas
5 products
Air Flow/Quality
11 products
Flow Switch
9 products
Flow Computer
3 products
Flow Accessories
2 products
Dosing/Batching
6 products - Level
Radar
3 products
Ultrasonic
1 product
Capacitance
7 products
Conductivity
4 products
Magnetic
1 product
Float/Buoyancy
7 products
Level Indicator
3 products
Vibrating Rod
3 products
Rotary Paddle
2 products
Hydrostatic
2 products
Optical
1 product
Level Switches
11 products - Calibration Devices
Multi Function Calibrators
2 products
Pressure Calibrators
4 products
Temperature Calibrators
6 products
Valve Testing
1 product
Calibration Software
1 product  Valves
Actuator
1 product
Ball Valves
2 products
Butterfly Valves
3 products
Gate Valves
2 products
Globe Valves
3 products- Analytical Sensors

Water Quality Sensors
16 products
Process Systems
11 products
Density and Concentration
12 products
Analytical Controller
2 products - Process Systems






How to implement a compressed air monitoring system: what to measure, where, and with which sensors


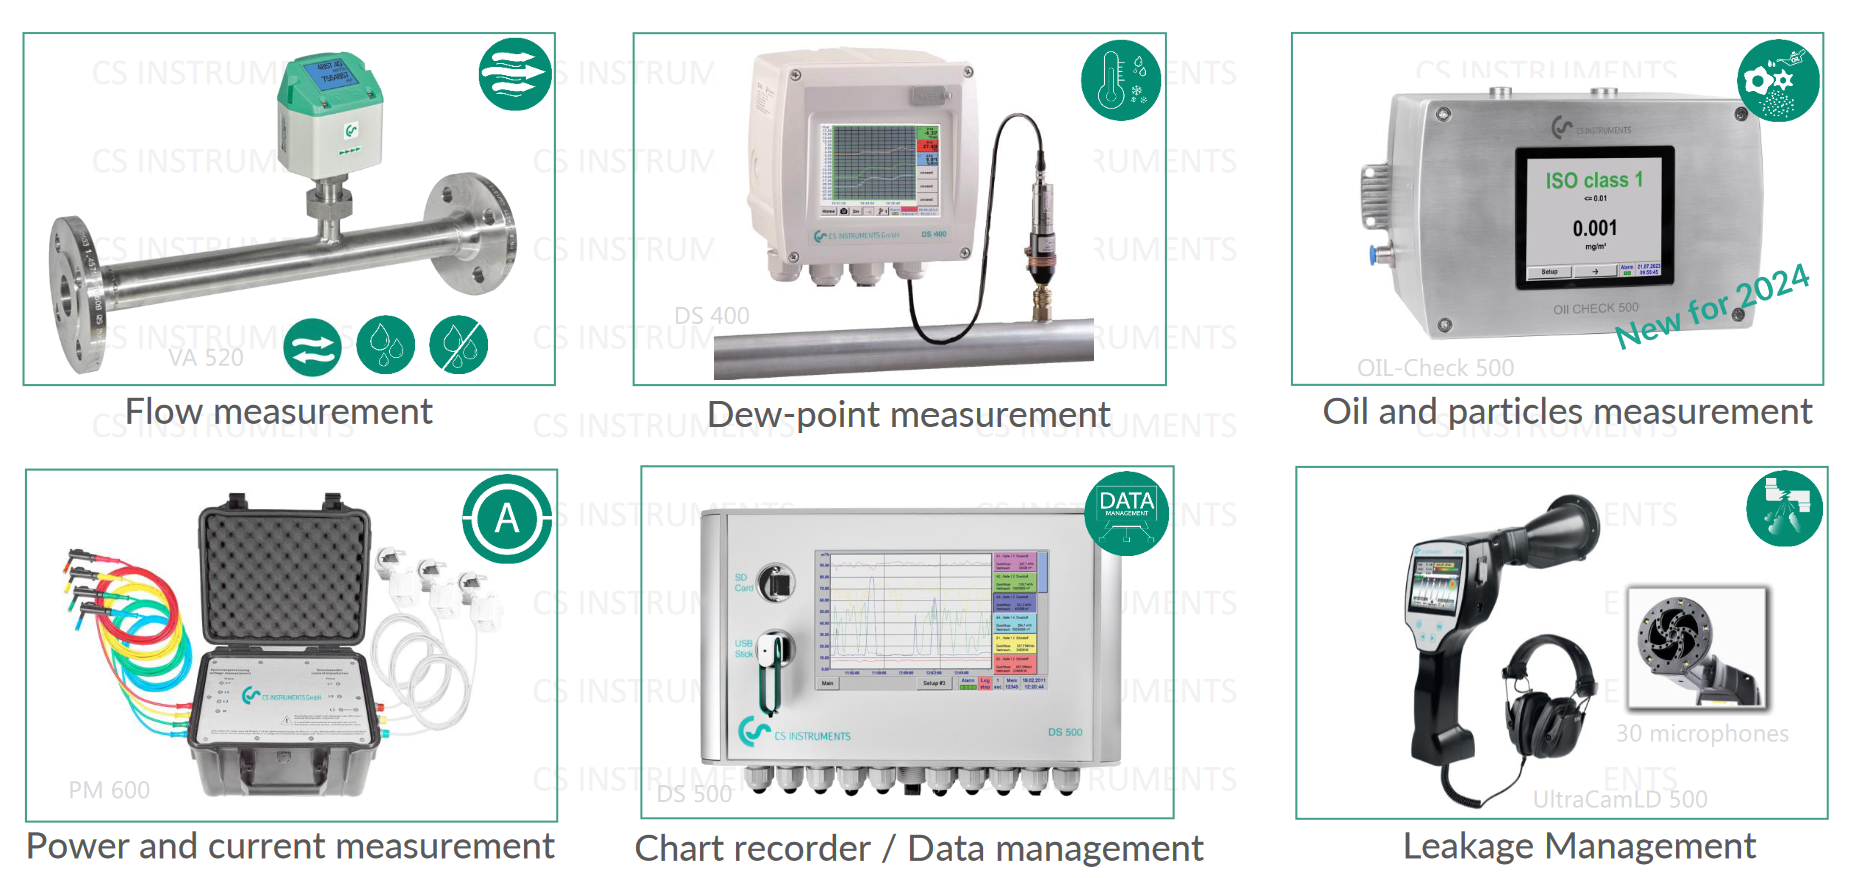
A compressed air monitoring system measures and records what a plant’s compressed air costs and delivers. It logs electrical power, flow, pressure and air quality, from the compressor room to the furthest machine. At its centre is a compressed air flow meter at each compressor and main line, with pressure, dew point and quality sensors around it.
Compressed air monitoring system: the short answer
- Measure power and flow at each compressor at the same time. Together they give the specific power, the energy needed per cubic metre of air.
- Measure flow in each main line or hall to see who uses the air. Then check what still flows when production stops and the machines are off: that is the leak load, unless equipment has been left running.
- Log pressure before and after the dryer and filters, and also at the far end of the network, to find pressure losses.
- Monitor pressure dew point after the dryer, and particles and oil where air quality matters.
- Finally, record everything in one place, compare it with production, and repeat the comparison after every change.
Why install a compressed air monitoring system
Most of what goes wrong in compressed air is invisible. A compressor that delivers less than its data sheet promises looks the same from the shop floor as a good one. So does a dryer that has stopped drying, a filter with a high pressure drop or a network full of leaks. However, each of them costs energy or product quality.
The US Department of Energy’s compressed air sourcebook therefore starts with a baseline. This first measurement sets out how the system performs today and what it costs, correlated with the plant’s production. Every improvement is then judged against it, so a compressed air monitoring system is what turns energy projects into numbers. In addition, the sourcebook notes that ongoing monitoring may form part of an energy management system under ISO 50001.
What a compressed air monitoring system measures
According to the DOE baselining method, a system needs measurements of power, pressure, flow and temperature under different operating conditions. It also needs an estimate of the leak load. Where the product or process needs clean air, air quality comes on top. Here ISO 8573-1 is the reference, since it classes compressed air by solid particles, humidity and liquid water, and total oil.
Supply side: the compressor room
The two tables below place each measurement in the network, first on the supply side and then on the demand side. Where Schmierer SEA offers a CS Instruments sensor for a point, it is named with the figures from our product page.
| Measuring point | What to measure | What it tells you | Instrument and stated figures |
|---|---|---|---|
| Compressor room air | Ambient pressure, temperature, humidity | Intake conditions affect compressor performance and the air volume delivered | IAC 500: 300 to 1,100 hPa absolute, -20 to +60 °C, 5 to 95 % RH |
| Each compressor’s supply | Electrical power (kW, kWh) | Together with the flow, the specific power of each compressor | An active power meter; the DOE prefers a kW meter with data logging to spot amp and volt readings |
| Compressor outlet, wet air (after the water separator) | Flow, pressure, temperature | Delivered air and free air delivery, so compressors can be compared in operation | VD 500: -30 to +180 °C, up to 30 bar, DN 20 to DN 600, typically ±1.5 % of reading. CMM 500: ±0.5 % of reading from 20 to 100 % of maximum flow |
| After the dryer | Pressure dew point | Whether the dryer works before water reaches the network | FA 510: for refrigeration, membrane and adsorption dryers; 4–20 mA and Modbus-RTU; IP66 |
Demand side and air quality
| Measuring point | What to measure | What it tells you | Instrument and stated figures |
|---|---|---|---|
| After the filters, or at a critical point of use | Particles and oil vapour | Filter breakthrough and oil carry-over, against the plant’s ISO 8573-1 target | PC400: from 0.1 or 0.3 µm, three size channels. Oil Check500: 0.001 to 5 mg/m³ at 3 to 9 bar |
| Main lines and each hall or production line, dry air | Flow and consumption | Who uses the air; also, flow during non-production hours is the leak load, unless equipment has been left running | VA series thermal mass flow: no moving parts; up to 40 bar (selected VA 520) or 50 bar (selected VA 550). VC600 clamp-on: pipes 25 to 90 mm outside diameter, from 3 bar(g) |
| Across the aftercooler, dryer, filters and pipework | Differential pressure and line pressure | Where the pressure is lost on the way to the machines | Matched, calibrated pressure gauges or differential pressure gauges, preferably with data logging (DOE) |
| The whole network, on rounds | Leak location and leak flow | Which leaks to repair first | LD500 and LD510 portable ultrasonic leak detectors with camera |
One caution on oil: our Oil Check500 page notes that the instrument monitors oil vapour only. On its own, it does not establish the complete ISO 8573-1 total oil class, since formal classification can also need laboratory tests of oil aerosols and liquid oil.
The figures a monitoring system gives you
Specific power of each compressor
CS Instruments defines specific power as the energy consumed in kWh divided by the air delivered in m³ over the same period. Its application note on compressor efficiency measures it with a VD 500 directly behind the compressor and an active power meter. The measurement can run as a short audit over 7 days or as permanent monitoring. Either way, it shows whether each compressor delivers what its data sheet states. The DOE adds that specific power should be compared at a given pressure. Moreover, better control in the compressor room lowers both the specific power and the total energy.
Leak load
When production stops and the machines are off, the flow that remains is leakage, unless equipment has been left running. The DOE lists flow meters among the ways to measure it, together with compressor duty cycles and receiver blow-down tests. A permanent flow meter on each main line therefore gives the compressed air monitoring system a leak figure at every production stop, without anyone walking the plant. Finding the individual leaks, however, is a separate job, set out in our guide on how to detect compressed air leaks.
Pressure profile and set point
The DOE recommends pressure readings at several points. These are the compressor inlet against atmosphere, the air/lubricant separator, the stages of multi-stage machines, and the aftercooler, dryers, filters and distribution system. When a differential is higher than the manufacturer’s specification, the component needs service. Pressure also costs energy. For systems around 100 psig (about 6.9 bar(g)), the sourcebook’s rule of thumb is that every 2 psi (about 0.14 bar) of extra discharge pressure raises energy use by about 1 per cent at full output. A logged pressure profile thus shows how far the set point can come down while the furthest machine still gets the pressure it needs.
Air quality trend
A continuous dew point, particle or oil reading shows a change as it happens, rather than at the next periodic check. For example, a rising pressure dew point is an early sign of a dryer problem. Similarly, a rising particle count downstream of a filter can mean filter breakthrough.
How to implement a compressed air monitoring system, step by step
- Draw the system first. The DOE uses a block diagram of every compressor, dryer, filter, receiver and main line, because it identifies all the components. We find it is also the easiest place to mark each measuring point.
- Decide the questions. These can be energy (specific power), consumption by area, leak load, air quality, or all four. Each question then needs different points from the table above.
- Measure a baseline. A mobile measurement over about a week shows the demand profile and the leak load before money goes into permanent sensors. During it, log power, flow and pressure together and note the production level for each period.
- Choose the permanent points and sensors. Use wet-air sensors at the compressor outlet and dry-air sensors in the distribution. For instance, the CMM 500 compressor master meter is a reference meter for free air delivery and for billing dry air. The VA series, by contrast, covers consumption in each line.
Installing and running the system
- Install with as little downtime as possible. The VD 500 goes in under pressure through a 1/2 in ball valve, and so does the VA 550 where its configuration permits. Meanwhile, the VC600 clamps onto the outside of the pipe. A flanged meter such as the CMM 500 needs the line opened, so plan it for a shutdown. In every case, follow the straight-run lengths in the manual.
- Connect and record. The VA series (on supported models), the VD 500 and the CMM 500 offer 4–20 mA, pulse and Modbus-RTU outputs. As a result, they can feed the plant’s PLC or SCADA, or a dedicated recorder.
- Set alarms and review. Alarm on dew point, pressure and quality limits. Then compare the energy and flow figures with the baseline after every change. The DOE also advises correlating with production, so that a busy month is not mistaken for a worse system.
Recording the data
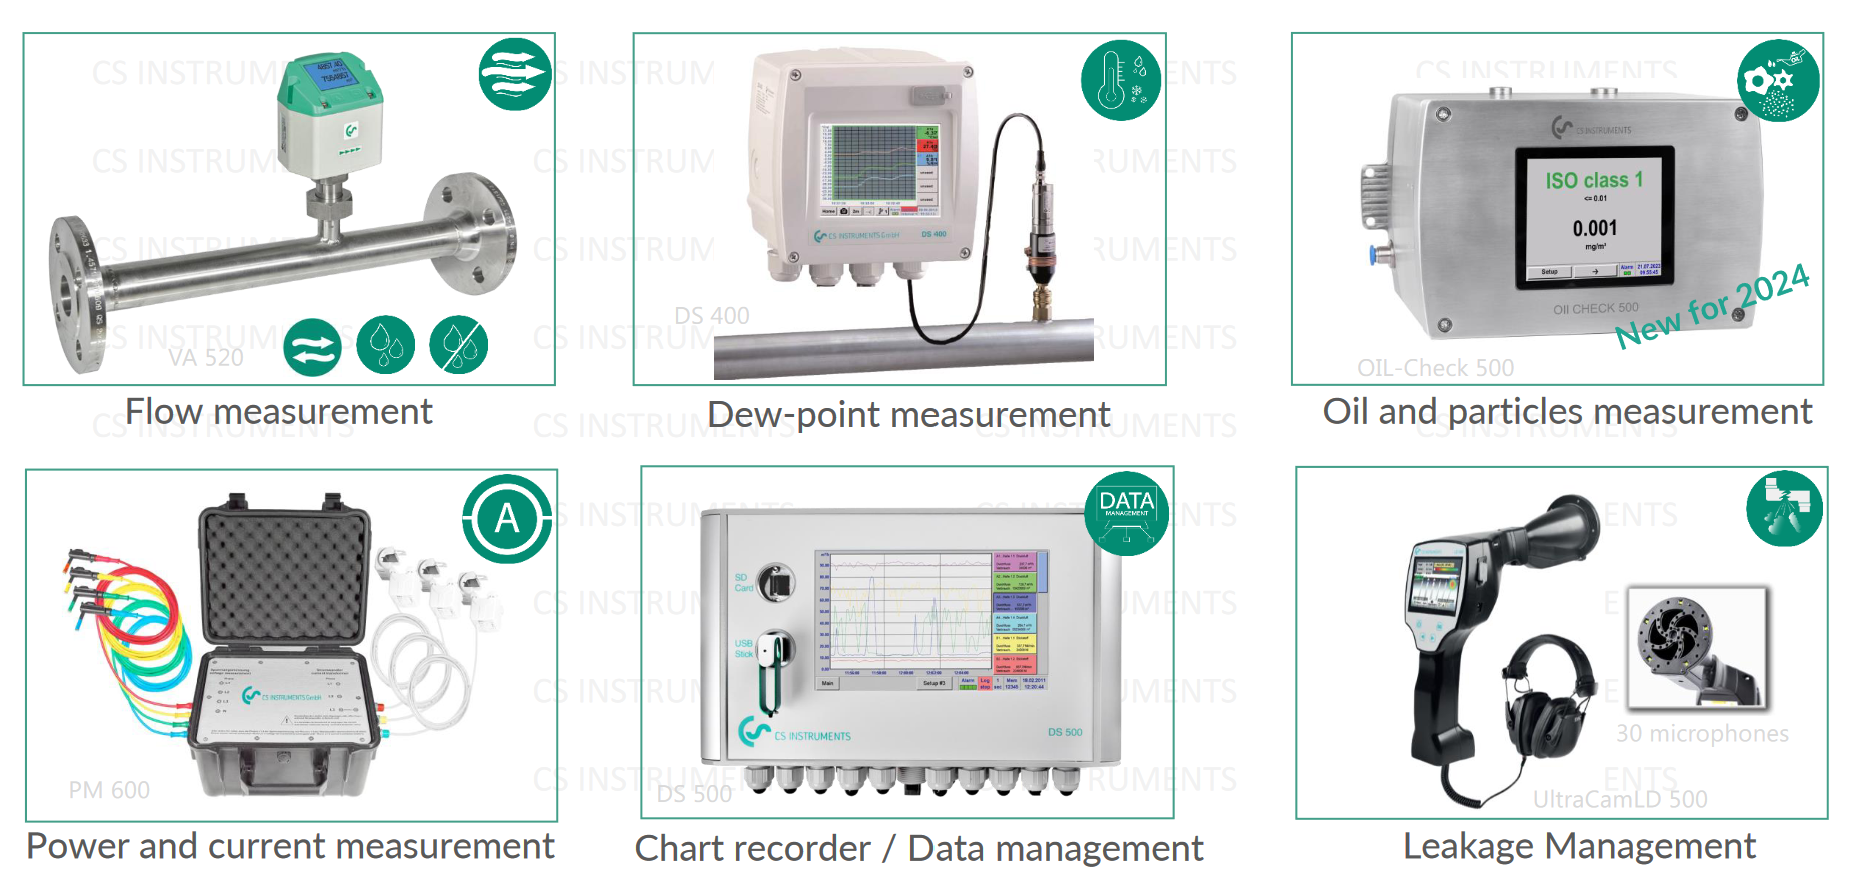
For a dedicated recorder at the heart of a compressed air monitoring system, CS Instruments’ DS 500 data sheet lists a basic version with 4 sensor inputs, which options extend to 8 or 12. That means up to 12 analogue or up to 40 digital Modbus-RTU sensors. The DS 500 powers the sensors. In addition, options add a mathematics function that calculates cost per m³ of air, kWh per m³ and the consumption of single lines, a totaliser for analogue signals and a web server for remote read-out. Because its inputs accept 4–20 mA, voltage, Pt100, Pt1000, pulse and Modbus signals, meters from other makers can be connected as well.
Choosing the instruments: five questions
- Wet or dry air? Hot, wet air at the compressor outlet needs a differential pressure sensor such as the VD 500 or CMM 500. Dry air after the dryer, however, suits thermal mass flow.
- Pipe size and pressure? These set the sensor version and length. They also decide whether a clamp-on meter fits.
- Can the line be opened? If not, choose insertion through a ball valve or clamp-on.
- What accuracy does the use need? Billing and compressor capacity tests need a reference meter, whereas trend monitoring of a hall does not.
- Where will the data go? Check the outputs against the PLC, SCADA or recorder before ordering.
Together, these answers are the design of your compressed air monitoring system. After that, the rest is installation and the discipline to read the data.
How Schmierer SEA can help
Schmierer SEA offers the CS Instruments range for compressed air, from the compressed air flow meter at each compressor to dew point, particle and oil vapour sensors and the LD500 leak detector. If you are planning a compressed air monitoring system, send us your block diagram or a list of compressors, pipe sizes and pressures. Our team in Shah Alam will then help you select the instruments and set them up: send an enquiry.
Related reading
- How to detect compressed air leaks
- Which compressed air flow meter should be used at which point?
- Real time energy monitoring of compressed air and gases
Disclaimer: This article is general engineering guidance from Schmierer SEA, not a specification or a safety recommendation for any particular installation. Confirm every figure against the instrument’s current datasheet and your plant’s procedures, and involve a qualified engineer for safety-related decisions. Information current as at November 2026.